Registration : 21mic7178 Name : Sai Sanjay K
Title : Image segmentation through boundary detection
Aim :
The aim of this experiment is to perform image segmentation through boundary detection using edge detection techniques.
Theory :
Boundary detection is a crucial step in image segmentation where the goal is to identify and locate the edges or boundaries within an image. Edge detection is a crucial step in image processing and computer vision, aiming to identify points where the image brightness changes sharply. These points typically correspond to the boundaries of objects within the image. Various edge detection methods are used, each with its own approach and sensitivity to noise and edge orientation. The Sobel, Prewitt, and Roberts methods are gradient-based techniques, while the Canny method is a multi- stage algorithm that provides robust edge detection.
CODE :
% Read and prepare the image

img = imread('cameraman.tif'); % You can replace with your image

if size(img, 3) == 3

img = rgb2gray(img); % Convert to grayscale if RGB

end

% Apply Gaussian smoothing to reduce noise

sigma = 1.5;

smoothed_img = imgaussfilt(img, sigma);

% Edge detection using different methods

edges_sobel = edge(smoothed_img, 'Sobel');

edges_canny = edge(smoothed_img, 'Canny');

edges_prewitt = edge(smoothed_img, 'Prewitt');

% Morphological operations to improve boundary detection

se = strel('disk', 1);

edges_dilated = imdilate(edges_canny, se);

edges_cleaned = imclose(edges_dilated, se);

% Watershed segmentation using edge information

D = bwdist(edges_cleaned);

D = -D;

D(~edges_cleaned) = -Inf;

L = watershed(D);

boundaries = L > 0;

% Region filling to get segments

filled_regions = imfill(boundaries, 'holes');

labeled_regions = bwlabel(filled_regions);

% Visualization

figure('Position', [100 100 1200 400]);

subplot(2,3,1)

imshow(img)

title('Original Image')

subplot(2,3,2)

imshow(edges_sobel)

title('Sobel Edges')

subplot(2,3,3)

imshow(edges_canny)

title('Canny Edges')

subplot(2,3,4)

imshow(edges_cleaned)

title('Cleaned Edges')

subplot(2,3,5)

imshow(label2rgb(L))

title('Watershed Segmentation')

subplot(2,3,6)

imshow(label2rgb(labeled_regions, 'jet', 'w', 'shuffle'))

title('Final Segmentation')

% Function to analyze segments

function analyze_segments(labeled_img)

stats = regionprops(labeled_img, 'Area', 'Centroid', 'BoundingBox');

num_regions = max(labeled_img(:));

fprintf('Found %d distinct regions\n', num_regions);

for i = 1:num_regions

fprintf('Region %d:\n', i);

fprintf(' Area: %d pixels\n', stats(i).Area);

fprintf(' Centroid: (%.1f, %.1f)\n', ...

stats(i).Centroid(1), stats(i).Centroid(2));

end

end

% Analyze the segments

analyze_segments(labeled_regions);
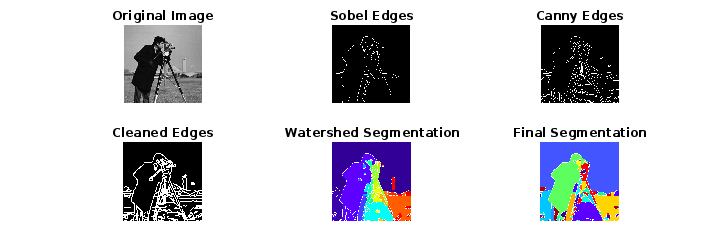
Sample Results :
 Result :
The edge-detected images show how different methods and orientations highlight the boundaries of objects in the image. Sobel and Prewitt methods give similar results, with the Sobel method being slightly more robust to noise. The Roberts method provides thinner edges but can be more sensitive to noise. The Canny method, known for its accuracy, provides well-defined edges and suppresses noise effectively.
Conclusion :
Different edge detection methods offer various advantages and trade-offs. Sobel and Prewitt are simple and effective for general purposes, Roberts provides thin edges but is noise-sensitive, and Canny is robust and precise but computationally more intensive. The choice of method depends on the specific requirements of the application.