Mermaid Chart
graph LR
    subgraph Clients
        A[Users]
    end

    A -->|Requests| B(Load Balancer)

    subgraph Kubernetes Cluster
        B --> C[Service A]
        B --> D[Service B]
        B --> E[Service C]

        C -. Traces .-> H[Jaeger]
        D -. Traces .-> H
        E -. Traces .-> H

        C --> I[Fluentd]
        D --> I
        E --> I
        I --> J[Elasticsearch]
        J --> K[Kibana]

        C --> F[Prometheus]
        D --> F
        E --> F
        F --> G[Grafana]

        L[Keycloak] --> C
        L --> D
        L --> E
    end

    subgraph CI/CD
        M[Jenkins/GitHub Actions]
        M --> KubernetesCluster
    end
With Istio and Hashicorp Vault
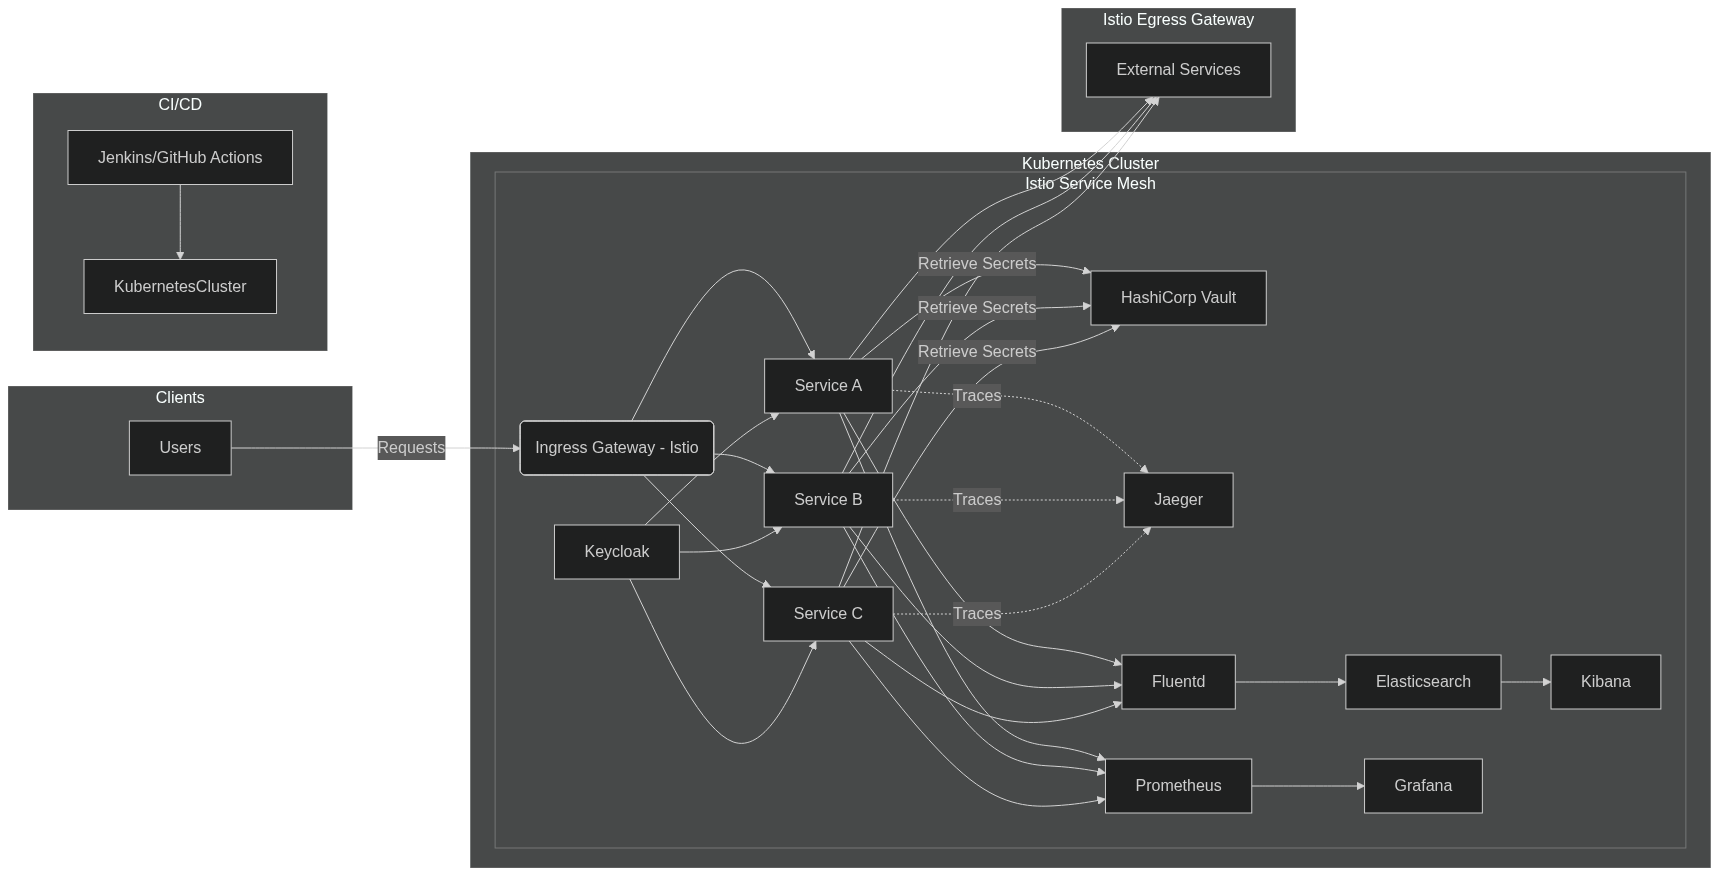
graph LR

subgraph Clients

A[Users]

end


A -->|Requests| B(Ingress Gateway - Istio)


subgraph Kubernetes Cluster

subgraph Istio Service Mesh

B --> C[Service A]

B --> D[Service B]

B --> E[Service C]

C -->|Retrieve Secrets| N[HashiCorp Vault]

D -->|Retrieve Secrets| N

E -->|Retrieve Secrets| N


C -. Traces .-> H[Jaeger]

D -. Traces .-> H

E -. Traces .-> H


C --> I[Fluentd]

D --> I

E --> I

I --> J[Elasticsearch]

J --> K[Kibana]


C --> F[Prometheus]

D --> F

E --> F

F --> G[Grafana]


L[Keycloak] --> C

L --> D

L --> E

end

end


subgraph Istio Egress Gateway

C --> O[External Services]

D --> O

E --> O

end


subgraph CI/CD

M[Jenkins/GitHub Actions]

M --> KubernetesCluster

end
Theory Shit
1. Architecture Overview
- Microservices Architecture: Break down the application into independent services to improve scalability and maintainability.
- Containerization: Use Docker to containerize services for consistency across environments.
- Orchestration: Deploy containers using Kubernetes for automated deployment, scaling, and management.
2. Scalability
- Horizontal Scaling: Kubernetes allows you to scale services horizontally by adding more container instances.
- Load Balancing: Distribute incoming traffic using Kubernetes services or external load balancers.
3. Monitoring
- Prometheus: Implement Prometheus for real-time monitoring and alerting of system metrics.
- Grafana: Visualize metrics and create dashboards using Grafana.
4. Tracing
- Jaeger: Utilize Jaeger for distributed tracing to monitor and troubleshoot transactions across microservices.
- Instrumentation: Instrument services with OpenTelemetry to collect trace data.
5. Logging
- Centralized Logging: Aggregate logs from all services to a central location.
- Fluentd: Use Fluentd to collect, filter, and forward logs.
- ELK Stack:
- Elasticsearch: Store and index logs for searchability.
- Logstash: Process logs before indexing.
- Kibana: Visualize logs and create analytical dashboards.
6. Role-Based Access Control (RBAC)
- Authentication and Authorization:
- Implement an identity provider like Keycloak for managing users and roles.
- Use OAuth 2.0 or OpenID Connect protocols for authentication.
- Kubernetes RBAC:
- Define roles and permissions within Kubernetes to control access to resources.
- Application-Level RBAC:
- Integrate RBAC into application services to restrict access based on user roles.
7. Managed Logs and Audit Trails
- Structured Logging: Incorporate contextual information (e.g., user ID, action) in logs.
- Audit Logging: Maintain logs of all access and actions for compliance and security audits.
- Log Retention Policies: Define how long logs are stored based on regulatory requirements.
8. Continuous Integration and Continuous Deployment (CI/CD)
- Pipeline Automation: Use tools like Jenkins, GitHub Actions, or GitLab CI/CD to automate testing and deployment.
- Container Registry: Store Docker images in a registry like Docker Hub or Harbor.
9. Security Best Practices
- Secret Management: Use tools like HashiCorp Vault or Kubernetes Secrets to manage sensitive data.
- Network Policies: Define Kubernetes network policies to control traffic between services.
- Encryption: Implement TLS/SSL for encrypting data in transit.
- Vulnerability Scanning: Regularly scan containers and dependencies for vulnerabilities.
Suggested Tools Summary
- Containerization: Docker
- Orchestration: Kubernetes
- Tracing: Jaeger, OpenTelemetry
- Logging: Fluentd, ELK Stack (Elasticsearch, Logstash, Kibana)
- Monitoring: Prometheus, Grafana
- RBAC: Keycloak, Kubernetes RBAC
- CI/CD: Jenkins, GitHub Actions, GitLab CI/CD
- Secret Management: HashiCorp Vault
- Security Scanning: Clair, Anchore
Benefits of This Design
- Scalability: Easily handle increased load by scaling services horizontally.
- Observability: Monitoring, logging, and tracing provide deep insights into system performance.
- Security: RBAC and managed secrets enhance security posture.
- Maintainability: Microservices and CI/CD pipelines streamline updates and deployments.
Implementation Steps
-
Set Up Containerization and Orchestration:
- Containerize applications using Docker.
- Deploy them on a Kubernetes cluster.
-
Implement Monitoring and Logging:
- Deploy Prometheus and Grafana for metrics.
- Set up Fluentd and the ELK stack for centralized logging.
-
Integrate Tracing:
- Instrument services with OpenTelemetry.
- Configure Jaeger for collecting and visualizing traces.
-
Configure RBAC:
- Set up Keycloak for identity and access management.
- Apply Kubernetes RBAC policies for cluster management.
- Implement application-level RBAC in your services.
-
Establish CI/CD Pipelines:
- Automate build, test, and deployment processes.
- Integrate security scans into the pipeline.
-
Enhance Security and Compliance:
- Manage secrets securely.
- Enforce network policies and encryption.
- Set up audit trails and compliance reporting.